Property does not drive culture. People do.
I have spent more than a decade building data products for corporate real estate. In that time I have watched property functions make the same two mistakes. They claim credit for things they do not control, and they ignore the one thing they hold that nobody else in the organisation has.
I think fixing both is how corporate real estate gets back to the executive table, and into the conversations about how the organisation uses AI.

Property is an enabler, not a driver
Organisations put people in buildings so they can work together on the products and services that make the organisation money. That is the job. It is an important job, but it is a supporting one.
Corporate real estate provides the places, HR puts the people in them, and finance counts the profit those people make. Property enables the people, and the people drive the profit.
Most property business cases say something different. A capital programme goes in: a refurbished floor, a new collaboration zone, a flagship office. Somewhere in the business case there is a line that says the investment drove engagement, or productivity, or profit.
I do not think that line holds up, and the oldest reason is more than sixty years old. In 1959 Frederick Herzberg and his co-authors split the things that shape how people feel about work into two groups. Motivators, such as recognition and the work itself, make people more satisfied when they are present. Hygiene factors only stop people being dissatisfied. Working conditions are one of Herzberg’s own examples. A bad office will drag morale down. A good office will not, on its own, lift it up. Herzberg’s theory has its critics, but I think his split between what drags people down and what lifts them up still holds for offices.
You will find plenty of studies that say otherwise, with office redesigns linked to double-digit productivity gains. Before you send me one, check who published it. Most of the ones I have seen come from furniture makers, design firms and interiors firms, and they have a commercial interest in the answer.
The Leesman Index is more independent. It has surveyed more than 1.6 million employees across more than 10,000 workplaces. Even Leesman does not show that space drives output. People in its surveys say they work more productively when the space suits what they actually do. Leesman measures what people say about the space. It does not measure output, and it does not link its scores to how much was spent. That fits Herzberg’s view.
The clearest warning I have found comes from Ethan Bernstein and Stephen Turban at Harvard. They studied two company headquarters that moved to open-plan offices, which is the textbook “this will drive collaboration” investment. They did not rely on surveys. They used wearable sensors and email and instant-messaging records. Face-to-face interaction fell by about 70 percent, and people sent more emails and instant messages instead. They did not measure productivity, and it was only two companies. It does show that a change to the space can make things worse, which fits Herzberg’s view.
This matters because every claim property cannot prove gives finance a reason to doubt the next one. The first time a CFO asks for the productivity data behind a fit-out and does not get a clear answer, the property function loses credibility it did not need to lose.
Where property undersells itself
Property functions also undersell something, and I think it could get them back to the executive table: the property hierarchy.
Every large organisation runs on three hierarchies that rarely line up:
- a people hierarchy, which says who reports to whom
- a financial hierarchy, which says which cost centre and which P&L
- a property hierarchy, which says which site, which building, which property and which floor
The link between them is simple. People are mapped to places. Every employee has a work location on record, usually a site or a building. Organisations need it for payroll and tax at the least, and most also use it for health and safety, fire evacuation and planning desks. Every employee is also mapped to a cost centre. So the person is the link. Through its people, the property hierarchy is already connected to the people hierarchy and the financial hierarchy.
I am not the first to say this. In 2025, Sara Jones and Yang Lee made the case in a paper called “Where Do They Work but Live? Establishing Location Master Data”. Drawing on an IT consulting firm’s work with its clients, they found that many organisations cannot consistently say which office, building or region a person works in, because HR, facilities, finance and travel each keep their own version. Their answer is one governed location master with a structured location hierarchy, which they describe as “a single source of truth”.
They give two everyday questions most organisations struggle to answer: how many employees live in one state but work in another, and why facility records and billing records disagree. They argue that one-off fixes for questions like these never deal with the cause. A proper location master, they say, also helps with crisis response, workforce planning, strategic planning, legal compliance and work across functions. They present it as something every part of the organisation uses, not something one department keeps for itself.
The reliable link is person to building. The floor and the desk are only known where seating is assigned or booked, and with hybrid working many people have no assigned desk. Anything finer than the building comes from booking and badge data, which is personal data with its own rules.
So property does not need a new system to start. The data that maps people to buildings, and people to cost centres, already exists. What property has not done is use that mapping for anything bigger than knowing who sits where and how many desks each team needs.
The problem is not the technology. Property uses the mapping to plan desks. I think it should use it to show the organisation who works where and what that costs, because it is the one place where people, cost and buildings can be tied together reliably, at least at building level.
Why the slowest hierarchy matters most
Org charts get redrawn often. In a McKinsey survey, almost 60 percent of executives said their organisation had been redesigned in the past two years. People join and leave within months. Finance moves cost centres around when it changes how it reports, and often nobody outside finance keeps track. Two of the three hierarchies are changing all the time.
The property hierarchy changes slowest of the three. Buildings and sites change on a cycle of years, not months. Lease exits, sub-lets and mergers still move it, so it needs versioning like anything else, but far less often. Because it changes so slowly, it is the cheapest of the three to hold steady and keep versioned, so it is the natural anchor to measure the other two against. If the organisation is a ship, the restructures and reporting changes are the sea churning around it, and the property hierarchy is the anchor that holds it in place.
For the data people reading this, that makes property a good candidate for a conformed dimension: a reference table that every fact can join to. That is much easier to keep consistent when it changes every few years rather than every year or two.
In data terms, the property hierarchy is three things at once. It is master reference data: one agreed list of sites, buildings and floors that every other system uses instead of keeping its own copy. It is a taxonomy: a set of levels where each level has one agreed definition and each item has one parent. And it is part of what data people call the ontology: the agreed set of things an organisation has and how they connect. People work in buildings, teams sit on floors, and products and services depend on the people in those places.
Others have argued for a single record of location. Jones and Lee argue for it mainly to improve data quality, legal compliance and planning. Jack Dangermond, Esri’s founder, has argued for years that location is what lets data from separate systems be joined up. Gartner has written since at least 2017 about a “digital twin of the organisation”, a live model of how an organisation runs. Gartner builds its version around business processes and the resources that run them, and in my experience organisations redesign their processes about as often as they redraw the org chart.
I have not found anyone who argues that location should be the reference the others are measured against because it does not need rebuilding every time the organisation restructures. Nor have I found anyone who argues that the property function should own it.
Map people to the property hierarchy. Map the same people to their cost centres, and each cost centre to the business unit and the products and services it serves. You end up with a map of which parts of the business depend on which places, and what the people in those places cost, built on data most organisations already hold.
What the property hierarchy actually is
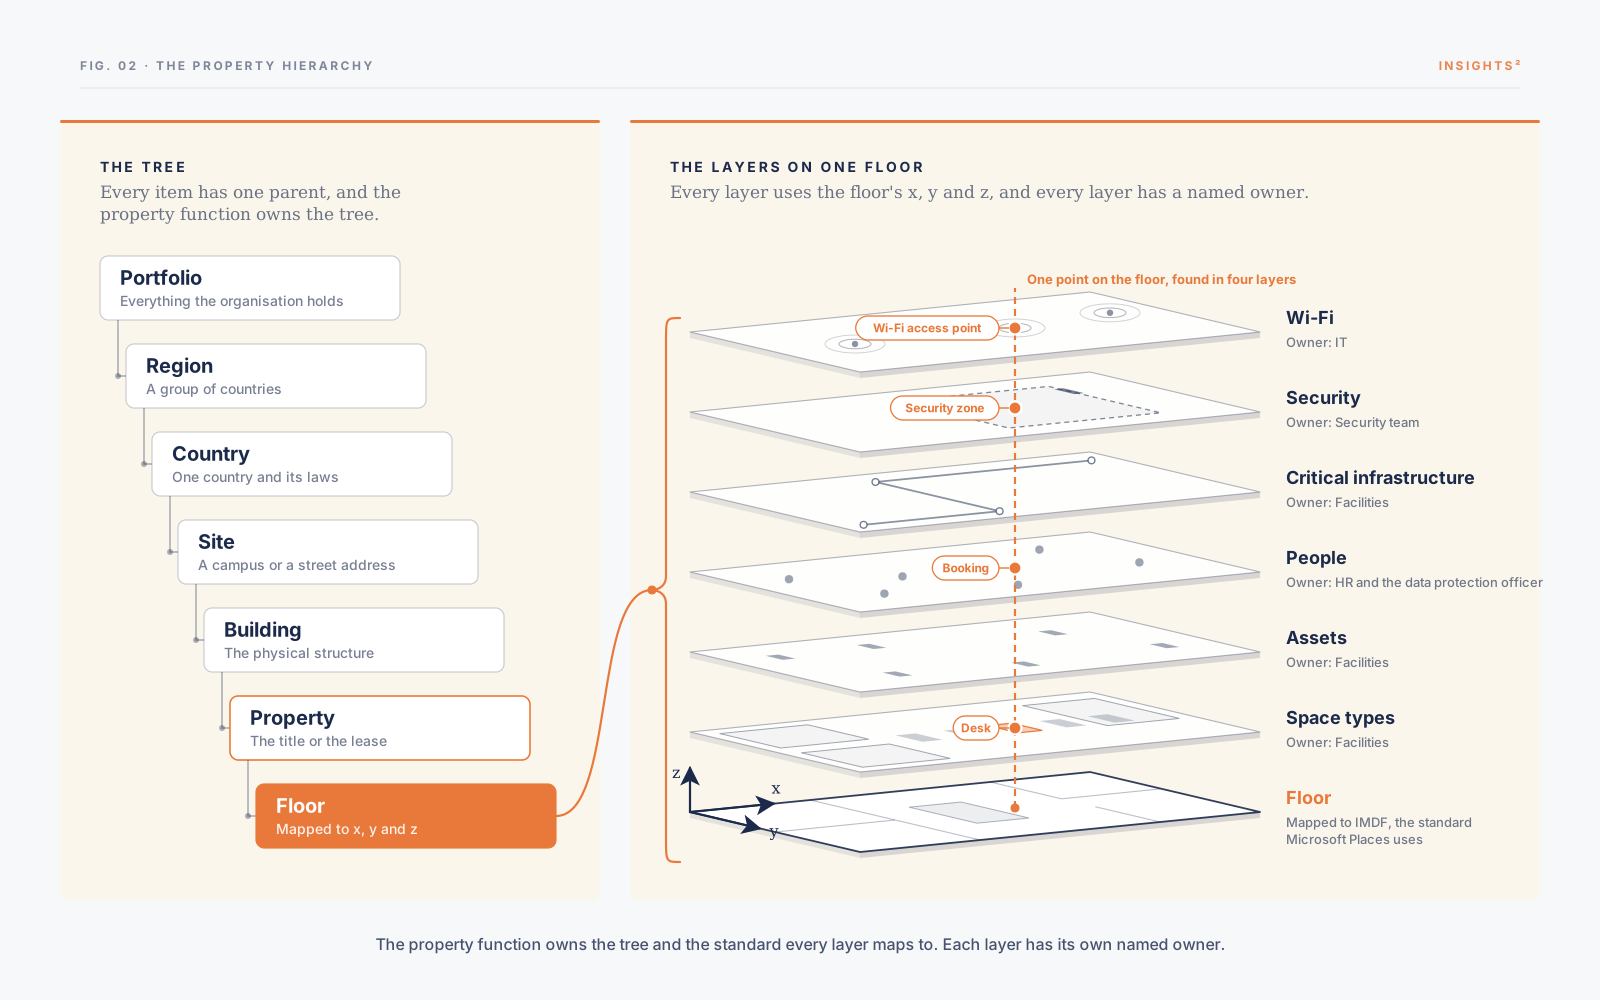
Saying property is the anchor is the easy part. Building it is where most attempts fall apart, usually in the first workshop. I think that happens because people try to fit everything into one hierarchy. It works better in two parts: a simple tree down to the floor, and layers on top of each floor. This is not a new design. The point is that property should own it.
I call it the property hierarchy, but others may call it location master data or a location hierarchy, which are the terms Jones and Lee use. It is the same list of places.

1. A tree down to the floor
The top of the hierarchy should be a plain tree: portfolio, region, country, site, building, property and floor. Every item has one parent, and the tree changes very rarely.
Each level needs an agreed definition. The word “building” is the best example. To facilities, a building is a physical structure. To finance, it is a legal entity: whatever is on the title or the lease. Those are two different things, so they need two levels. A building is the physical structure. A property is the legal or financial entity: the title or the lease. Property sits under building, because one building can hold several properties: a strata title with a different owner for each floor, a tower where each floor has its own lease, or a sale and leaseback of part of the building. Each floor then sits under the property that holds it. Where one floor is split between two properties, that floor needs a record under each of them.
The floor is where the tree stops, and it needs to be precise. Every floor should be mapped to a standard, so that every point on it has a real position: x and y across the floor, and z for the floor itself. Microsoft Places already works this way. It holds buildings, floors, sections, rooms and desks, and its floor maps use the Indoor Mapping Data Format (IMDF), an indoor mapping standard that Apple created and the Open Geospatial Consortium published in 2021. IMDF ties each floor plan to its real location in the world. I wrote about why Places matters in The Big Bet on Data-Informed Design. If your organisation already runs Microsoft 365, I would start there rather than invent a format of your own. Microsoft itself says building the IMDF files is complex enough to need a specialist partner, so start there for the model, not because it is quick.
2. Layers on top of the floor
Below the floor, a tree stops working. A desk is a type of space. It has a person sitting at it. It is near a Wi-Fi access point, inside a security zone and close to a fire exit. All of those are true at once, and none of them is the parent of the others.
So instead of adding more levels, I add layers. Each layer is a set of things placed on the floor using the same x, y and z:
- Space types: desks, meeting rooms, quiet rooms and kitchens
- Assets: furniture, screens and equipment
- People: who is assigned to or has booked which space, and which team they belong to
- Critical infrastructure: power, cooling, comms rooms and fire systems
- Security: access zones, card readers and cameras
- Wi-Fi: access points and the areas they cover
The list does not stop there. Because every layer uses the same coordinates, you can see what sits near what. The relationships that matter, such as which person is assigned to which desk or which room depends on which comms room, still have to be recorded and owned. Together those relationships make the layers a graph: each item is a node, and each relationship between two items is a link, with as many links as really exist. This is how master data tools now handle relationships that run sideways as well as up and down.
Some layers belong higher up the tree. Power, cooling and comms rooms appear on each floor, but they usually serve the whole building. Access control starts at the building entrance, and leases and titles belong to the property. Figure 3 hangs each of those layers off the level it serves.
3. Every layer has an owner
With layers, someone can add a new kind of thing without touching the tree. Each layer can change at its own pace. The Wi-Fi layer changes when IT moves an access point. The people layer changes every week. The tree underneath stays the same.
That only works if every layer is governed. Each layer needs a named owner: IT for Wi-Fi, the security team for security, facilities for space types and HR for people. Each owner runs their layer as governed master reference data. Every change is approved, dated and tracked, the same way organisations already run their chart of accounts.
The people layer needs the most care. A record that says which person sat where, and when, is personal data. HR and the data protection officer should own the rules for it, and in some countries the works council has a say. The questions in this essay need headcount by building, not individuals by desk.
Property owns the tree and the standard that every layer has to map to. Property can credibly own the tree because it already holds the leases and the floor plans. Owning the tree does not mean owning the other layers, and agreeing who owns each layer is work property has to do with IT, HR, security and facilities.
Where money comes in
The people layer connects the estate to the rest of the organisation. Each person is mapped to a cost centre, and each cost centre to the business unit and the products and services it serves.
That tells you which products and services depend on which places, and what the people in those places cost. It does not tell you what a floor earns. Profit is reported at business-unit level, and finance splits shared costs using its own rules, so any profit figure for a floor would only reflect those rules.
That is still far more than a rent bill. People do not sit in a building to be charged for the floor space. They sit there to build products and deliver services. With this model you can see, floor by floor, which products and services would be affected if that floor closed, and what the people on it cost.
This is close to POLDAT (process, organisation, location, data, application, technology), which CSC built into its Catalyst methodology in the early 1990s and other firms have used since. POLDAT treats location as one of six equal domains. My argument is narrower. Location is the one the others should be conformed against, because it is the one that changes least while you are trying to measure it.
Why this matters more now that AI agents are here
Organisations are now putting AI agents into everyday work. The people building them call the job of deciding what information an agent sees at each step context engineering. Anthropic and LangChain have both written about it. Data vendors and Gartner have taken it further this year: they argue the information has to be governed and trusted before it is worth giving to an agent.
When data vendors and Gartner write about what agents need, they keep coming back to two things. The first is identity: who or what is asking. The second is master data: the agreed lists of customers, products and assets, which must not change halfway through an answer.
In the Decision Outcome Framework, this is the semantic layer: the agreed definitions an organisation gives its people, its reports and now its agents, so that a term means the same thing everywhere. It defines two things: the numbers, such as headcount or cost, and the things being counted, such as people, products and buildings. Data people call the agreed set of things the ontology, and the property hierarchy is part of it. Ask an agent for headcount by building, and it needs to know what counts as headcount and which buildings exist. If HR, finance and facilities each keep their own list of buildings, as Jones and Lee found, the agent will give three different answers that all look right.
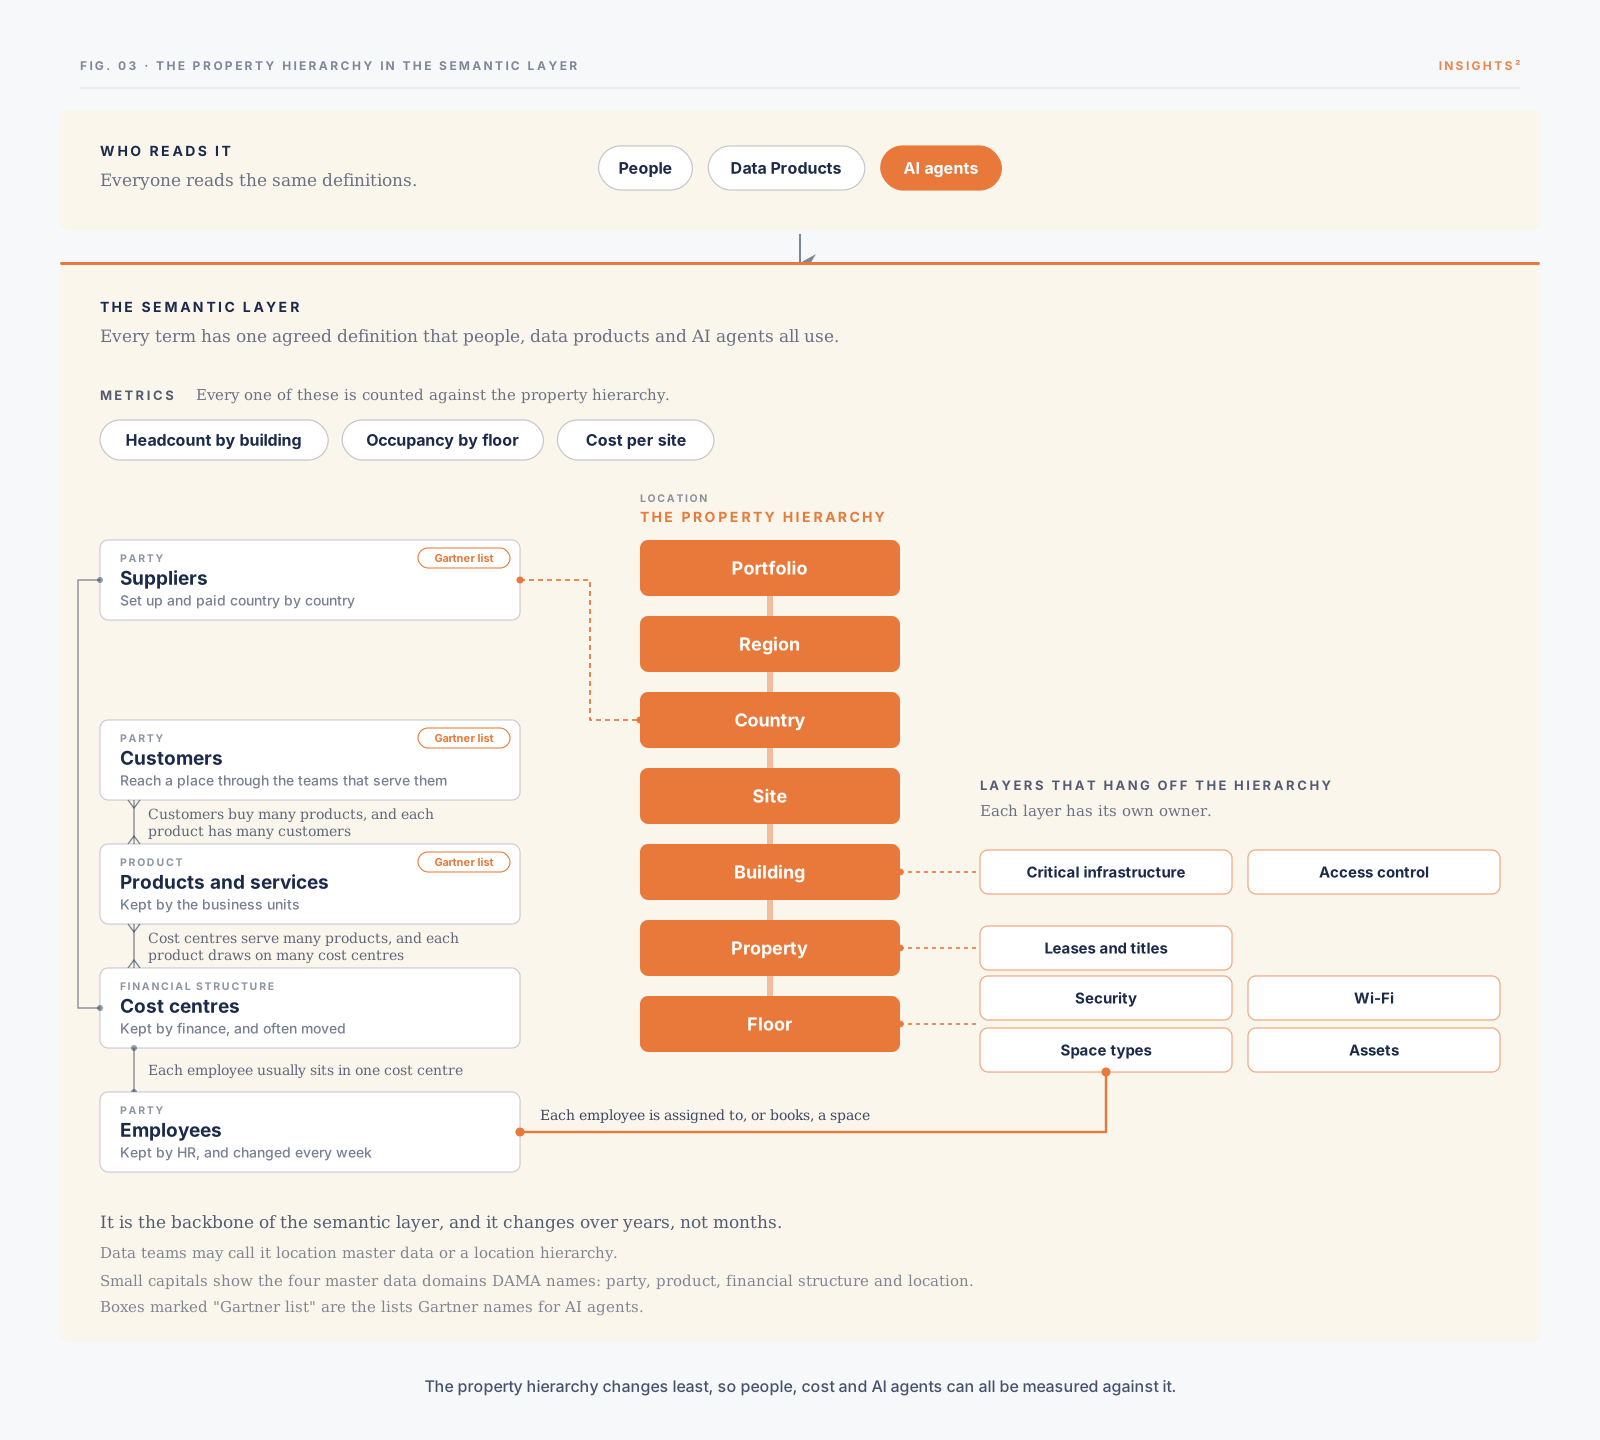
Location is already one of the standard lists. DAMA, the professional body for data management, names four: parties, such as customers, suppliers and employees; products; financial structures, such as cost centres; and locations. What I have not seen is anyone treat the estate as something an agent should use. Through the people mapped to each building, the property hierarchy is already linked to headcount and cost. Nobody I have read treats it as AI infrastructure.
Most people working on this would not put property on the list. In June 2026 Gartner wrote that AI agents need “an authoritative view of the customers, suppliers, and products” they reason about. Location is not on that list. I think it should be, and near the top.
Customers, suppliers and products tell an agent what the organisation sells and buys. They do not tell it where the organisation does its work, who does it, or what that work costs. If an organisation wants AI to help with decisions about the organisation itself, such as where to grow, what to consolidate, which teams depend on which sites and what a restructure will cost, the agent needs the property hierarchy, with people and cost centres joined to it. Of all the taxonomies an agent needs, it is also the one that changes least. That is why it matters so much. It is the anchor that everything else, including the agent, can be measured against while the rest of the organisation moves.
This is my opinion, and I have not found anyone else who holds it. I would put the property hierarchy alongside customer and product as one of the most important taxonomies an organisation owns.
I am not saying property is the whole answer to grounding AI agents. I am saying property is missing from a conversation about a problem it is good at solving, which is staying stable while everything else changes.
That is how corporate real estate gets into the core conversations about organisational AI. Property does not get there by asking for a seat. It gets there by bringing something the AI team needs and cannot build without property: an agreed, versioned list of every place the organisation works, with its people and costs already joined to it. Property should raise this before whoever builds the organisation’s semantic layer builds it without them.
What I am sure of, and what I am not
I am fairly sure of two things. Space is a hygiene factor, so property should stop claiming it drives sentiment. And most large organisations already map their people to buildings and to cost centres, so the link between people, property and cost already exists at building level.
I am less sure how many estates have a hierarchy clean enough to start from, whether a property function can win the argument to own this inside its organisation, and how far HR and works councils will let a people layer go. If you have tried to build something like this, I would like to hear how far you got.
Where this leaves corporate real estate
None of this means property should retreat into a back-office cost line. It means property should stop making claims it cannot prove.
Stop leading with the capital programme as a driver of sentiment. Start leading with the property hierarchy as the anchor the rest of the organisation can be mapped against, because it is the one part of the business that does not get redrawn every year or two.
Map people to property, people to cost centres, and cost centres to the products and services they serve. Get those three mappings right, and property can show the organisation who works where, on what, at what cost, and which products and services depend on which places.
I think the property hierarchy is the most stable reference an organisation owns. Build the tree down to the floor and the layers on top of it properly, and you have the stable half of a digital twin of the organisation. Gartner’s twin is built around processes and resources and simulates change. Mine does neither. It is the fixed reference that kind of twin needs, and the anchor any AI working across the organisation will need. Property is the function best placed to own it, because property is the part of the organisation that changes least while everything else moves.
Frequently Asked Questions
What is a property hierarchy?
A property hierarchy is the agreed list of every place an organisation uses. Data teams often call it location master data or a location hierarchy. It runs from portfolio down to floor, and every item has one parent: portfolio, region, country, site, building, property and floor. A building is the physical structure, and a property is the title or the lease. On top of each floor sit layers such as space types, assets, people, critical infrastructure, security and Wi-Fi, which all use the same x, y and z position.
Does better office space make people more productive?
Not on its own. Herzberg's motivation-hygiene theory treats working conditions as a hygiene factor: a bad office drags morale down, but a good office does not lift it up by itself. The Leesman Index finds that people say they work more productively when the space supports the activities they actually do, and Bernstein and Turban found that two headquarters that moved to open-plan offices saw face-to-face interaction fall by about 70 percent.
Why should the property hierarchy be the reference for organisational data?
Because it changes slowest. Org charts get redrawn often and finance moves cost centres when it changes how it reports, but buildings and sites change on a cycle of years. Every employee already has a work location on record and a cost centre, so the person links the property hierarchy to the people and financial hierarchies. That makes property a good candidate for a conformed dimension that the faster-moving data can be measured against.
Why does the property hierarchy matter for AI?
An AI agent needs agreed definitions to reason over, and those definitions sit in the organisation's semantic layer. Gartner names customers, suppliers and products as the master data agents need. They tell an agent what the organisation sells and buys, but not where its work happens, who does it, or what it costs. The property hierarchy does, through the people mapped to each building and their cost centres. It is also the taxonomy that changes least, which makes it the anchor the other data, and the agent, can be measured against.
Is the property hierarchy a digital twin of the organisation?
Not on its own. Gartner describes a digital twin of the organisation as a live model of how an organisation runs, built around business processes and the resources that run them. A governed property hierarchy is the stable part such a model needs: the fixed reference that people, cost and services can be mapped to while everything else changes.
Notes
- Herzberg
- Frederick Herzberg, Bernard Mausner and Barbara Bloch Snyderman, The Motivation to Work, Wiley, 1959. Herzberg summarised the theory in "One More Time: How Do You Motivate Employees?", Harvard Business Review, 1968. Source
- Leesman Index
- Leesman reports 1,644,497 employees surveyed across 10,775 workplaces, as at 31 March 2026. Source
- Open-plan offices
- Ethan S. Bernstein and Stephen Turban, "The impact of the 'open' workspace on human collaboration", Philosophical Transactions of the Royal Society B, 2018. Face-to-face interaction fell by about 70 percent at both headquarters, and electronic interaction rose. Source
- Location master data
- Sara Jones and Yang Lee, "Where Do They Work but Live? Establishing Location Master Data", AMCIS 2025 TREOs, 2025. Source
- Conformed dimensions
- Kimball Group, "Conformed Dimensions", dimensional modelling techniques. Source
- Digital twin of the organisation
- Gartner, Digital Twin of an Organization platforms, market definition. Source
- Microsoft Places
- Microsoft Learn, "Quick setup for buildings and floors" and "Setting up maps in Places". Places floor maps must be IMDF files that are georeferenced, and Microsoft recommends a specialist partner to create them. Source
- IMDF
- Open Geospatial Consortium, Indoor Mapping Data Format, OGC Community Standard 20-094, version 1.0.0, 2021. Apple created the format for Apple Maps. Source
- POLDAT
- POLDAT (process, organisation, location, data, application, technology) comes from the Domains of Change in CSC's Catalyst methodology. Source
- Context engineering (Anthropic)
- Anthropic, "Effective context engineering for AI agents", 29 September 2025. Source
- Context engineering (LangChain)
- LangChain, "Context Engineering for Agents", 2 July 2025. Source
- Agent context layer
- Snowflake, on the context layer data agents need, 19 March 2026. It lists semantics, identity, constraints, policy and provenance. Source
- Org redesigns (McKinsey)
- McKinsey Quarterly, "Getting organizational redesign right". Almost 60 percent of respondents said they had experienced a redesign within the past two years. Source
- Master data domains (DAMA)
- DAMA International, Data Management Body of Knowledge (DMBOK), as summarised on Wikipedia: the most common master data domains are parties, products, financial structures such as ledgers and cost centres, and locational concepts. Source
- Master data for AI agents (Gartner)
- Stephen Kennedy, Gartner, "How Master Data Management Boosts the Context Layer for AI Agents", 17 June 2026, as summarised by Ataccama. It names customers, suppliers and products. It does not mention location. Source
Where the evidence for the workplace already sits.
The Big Bet on Data-Informed Design looks at how Microsoft Graph and Microsoft Places could tell an organisation how people actually use its space.
Read The Big Bet on Data-Informed DesignMark Cunningham is the founder of Insights². He has spent more than a decade building data and analytics products for corporate real estate. He writes at insights-2.com about how to make the meaningful measurable.