For the last twelve months, my LinkedIn feed has been full of posts about the death of the dashboard. The argument went like this. A large language model can give you an answer in text, on the fly, to any question you ask. So why would anyone need a dashboard? In July 2026, IDC published a piece titled “Dashboards Are Dead”, which said dashboards are dead “because intelligence no longer needs a destination.” IDC’s main complaint was a different one: “The challenge with dashboards is simple: they require users to interrupt their workflow.” I agree that people should not have to leave their work to find a number. But a chart that appears in Teams or Slack still needs governed numbers behind it.
Then, on 8 October 2026, Anthropic released Claude Dashboards.
Within a week, the same feed was full of people showing off the dashboards Claude had built for them. The people in my feed spent twelve months saying dashboards do not matter, then took one week to start celebrating them.
Both claims cannot be right. I think the first was wrong from the start, and the second is excited about the easy part. The dashboard was never dead, and building one was never the hard part.
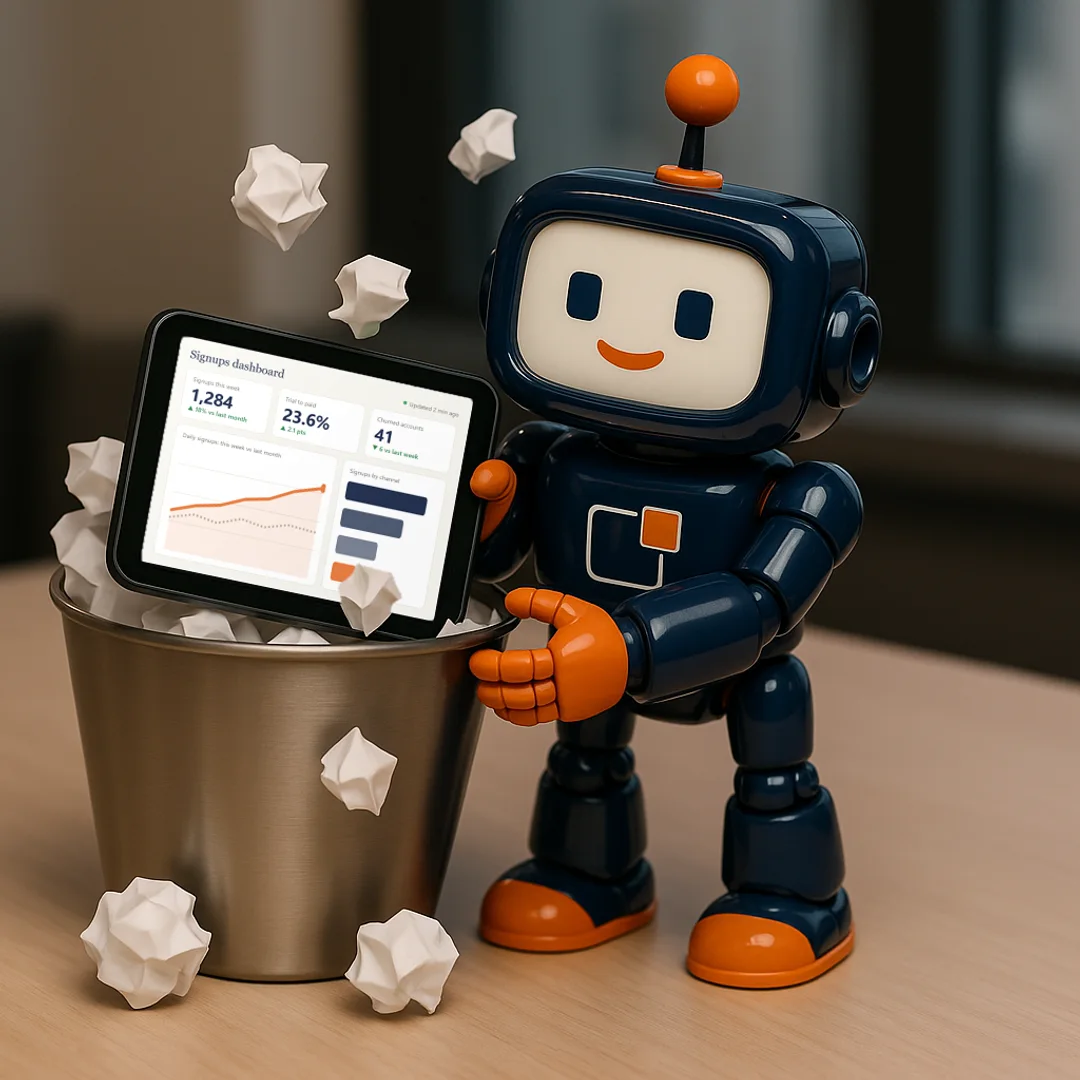
Why dashboards were never going to die
In 2004, Stephen Few defined a dashboard as “a visual display of the most important information needed to achieve one or more objectives”, arranged “so the information can be monitored at a glance.” That is the definition I use. It does not matter whether a person builds the dashboard or Claude does. A picture tells a thousand words.
People are visual. We take a complex world, thin-slice the data that matters, and make a decision. A trend line, a gap against a target, or one bar that is far taller than the rest gets seen in a second. The same facts in a paragraph of text take much longer to read, and are easier to miss.
This is not a matter of taste. It is how the human eye and brain work.
Some visual features, such as colour, size, position and length, are picked up before we consciously look for them. These are called pre-attentive attributes. Christopher Healey and James Enns describe a task as pre-attentive when people can do it on a busy display in less than 200 to 250 milliseconds. That is about how long the eye takes to start moving, so it all happens in a single glance. One orange bar among grey ones gets seen before you decide to look for it.
Then there are the Gestalt principles of design: proximity, similarity, enclosure, closure, continuity and connection. They explain why people see things that sit close together as a group, and things that share a colour as related. Cole Nussbaumer Knaflic sets them out well in Storytelling with Data. A good dashboard uses them on purpose, so the reader sees how the page is organised before they read a single number.
And the speed matters more now, not less. As AI takes on more of the work, people have to make more decisions, faster, to keep up with it and to stay in control of it. Someone has to check what the agents did, spot the number that looks wrong, and decide whether to step in. The fastest way for a person to take in a lot of data at once is to look at it. I do not see the dashboard disappearing.
So wherever a person is part of the decision, they will need to see the data, and that means a dashboard of some kind. Asking a chat window a question is useful. It does not replace looking at the numbers.
Dashboards are not dead. AI has changed how they get made. It has not changed why people need them.
Dashboards are easy, and they just got easier
Claude Dashboards is a good piece of work. You connect a data platform such as Snowflake, BigQuery or Databricks, you ask a question in plain language, and Claude builds the dashboard and keeps it current as the data changes. You can click any number to see the query behind it, and each chart shows when its data was last refreshed. I like that, and I will use it.
Building a dashboard now takes one sentence.
But let’s be honest. Drawing the charts was never the hard part. Designing a page people read correctly takes skill, which is why Step 5 checks it. Getting the numbers right is harder still. Principle 5 of my Data Guiding Principles is “Dashboards are easy. Data is hard.”
Dashboards are easy… and they just got a lot easier. The data underneath them has always been the hard part, and it still is.
Dashboards are easy… and they just got a lot easier. Data is still hard.
Implicit trust just became a major risk
Ask Claude to compare this week’s signups with last month’s, which is Anthropic’s own example. What is a signup?
- Is it an account created, an email confirmed, or a first login?
- Does a free trial count?
- Does a customer who leaves and comes back count twice?
Ask the same question in two different prompts and you can get two valid queries that return two different numbers. You can click through to the query behind both. Both will look polished. Neither will tell you which definition the business agreed, because in most organisations nobody has agreed one.
That is implicit trust. People trust the number because it is on a dashboard and the dashboard looks right. Anthropic’s own data team describes the danger in one line: “The answer is wrong, but looks plausible and is used without objection.”
Implicit trust was already a problem. In a 2022 HFS Research study, 75 percent of business executives said they did not have a high level of trust in their data. Self-service BI tools such as Tableau and Power BI had already given us too many dashboards that nobody checked. AI removes the last barrier, which was knowing how to use the tool. Now anyone can build one with a sentence, and an organisation will soon have thousands. Most of them will look polished. Some of them will be wrong. You will not be able to tell which from the screen.
AI did not create implicit trust. It made it far easier to act on a number nobody has checked.
Explicit trust on governed data is now a must
Explicit trust means someone has written down what each number means, someone owns the rules behind it, and someone has checked the dashboard before anyone acts on it. That is what the Decision Outcome Framework exists to do. It has five steps: Curate the question, Conform the data, Clean the data, Connect the product, and Certify the insight.
Curate
the question
Start with the right question, not the nearest dataset
Conform
the data
Shared definitions across every source and team
Clean
the data
Quality rules that catch errors before the boardroom does
Connect
the product
Package your governed data into a live data product, defined once, published, and ready for any team to use with confidence
Certify
the insight
A formal mark of quality on every insight you ship
Building the dashboard is not one of the five steps. It happens between Step 4 and Step 5, and I left it out on purpose. In more than a decade of building data products, I have rarely seen a dashboard fail because it was hard to build. AI has made the build almost free. All five steps are still there.
Step 1: Curate the question
A prompt is not a business question. “Compare this week’s signups with last month’s” tells Claude what to draw. It does not say which decision the comparison feeds, who makes that decision, or what number would make them act. Claude will answer the wrong question faster and more fluently than any developer I have worked with.
Step 2: Conform the data
Step 2 produces a semantic layer: one governed definition for every metric, so a term means the same thing everywhere. An AI that writes its own query for every chart will make its own choice of definition every time, unless someone has written the agreed one down.
Step 3: Clean the data
Data is a shadow of process. If sales reps create a new CRM account every time a customer changes email address, Claude will count every one of those accounts, accurately and instantly. Step 3 writes down the business rules for each critical field and names the person who owns them. No tool at the reporting end can fix a process that nobody owns.
Step 4: Connect the product
Ask a question that needs both the warehouse and Salesforce, and Claude will pick a join. Whether it picks the right one depends on whether the customer ID means the same thing in both systems. Step 4 settles that and joins everything into one data product a team can rely on.
Step 5: Certify the insight
Before a dashboard ships, someone checks it against two gates. The first is business alignment: does it answer the question it was commissioned to answer? The second is design quality: is it built to an agreed standard, rather than the version each developer carries in their head? Then it gets an explicit verdict: certified, conditional, or not certified. When an organisation has thousands of dashboards, this is the step that tells people which ones to trust.
Step 5 does not write the definition of a signup. Step 2 does that. Today, Step 5 checks the question and the design. In time, it will also check that the data underneath matches what Steps 2 to 4 agreed.
The same AI that multiplies dashboards can apply a certification rubric to the thousandth one exactly as it did to the first. That is what Meridian, the product I build, does at Step 5. But AI should not mark its own work. Anthropic’s data team has a separate reviewer check every query Claude writes, and its instructions to Claude say “do not self-certify”. The team also requires “explicit human sign-off on anything leadership-bound”.
Anthropic’s own data team says the same thing
You do not have to take my word for it. On 3 June 2026, Anthropic’s data team wrote up how they run analytics inside Anthropic. They say 95 percent of their business analytics queries are now automated through Claude, with about 95 percent accuracy overall.
Claude answers their questions in text, with a footer that says where each number came from. That sounds like the “dashboards are dead” argument. But the team still runs a daily check of each area’s top numbers that “sanity-checks against the blessed dashboard”, and it builds the tests for its most common questions from dashboards. Even the team that answers questions in text keeps one governed dashboard as the version everyone agrees is right.
The interesting part is what they say it took. It was not a better model. It was the work underneath, and almost every point they make says the same thing as one of my Data Guiding Principles:
- “Clarify the ask before querying.” Their agents are told to pin down the time period, the segment and “the business decision it informs” before they write a query. That is Principle 1: “If you can’t curate the question, it’s not important.”
- “Fewer, more heavily governed logical models.” They found the most common failure was the agent not being able to map a concept to the right data, and this was their fix. They also tried generating metric definitions automatically, and a smaller, human-curated semantic layer did better. That is Principle 2: “Not all data is created equal.”
- “Standard data engineering practices like dimensional modeling are just as important as they ever were.” Dimensional modelling, which Ralph Kimball set out in the 1990s, joins every fact to one shared set of dimensions, instead of building a new table for every question. That is Principle 4: “The data team creates connections, not copies.”
- Business context is “the layer most teams skip.” Without it, they say, an agent “will answer what the user asked, but not what they meant.” That is Principle 6: “Words mean stuff.”
Their warning about answers that look plausible and are wrong applies to dashboards just as much. That is why Principle 5 says “Dashboards are easy. Data is hard.”
Put that list next to the five steps. Clarifying the question and the decision it informs is Step 1. Dimensional modelling and a small set of governed datasets are Steps 2 and 4. Business context sits across Step 1 and Step 2. Their evaluations, which check answers against known correct answers, do the job of Step 5.
The team that builds Claude did not get to 95 percent by trusting the model. They got there by doing the hard data work first. That does not change because the dashboard got easier to build.
An open question: art or science?
There is one question I cannot answer yet. Have the AI tools got the design principles down pat, or have they focused on making dashboards look good rather than read well?
A dashboard can be beautiful and still be hard to read. Too many colours, no clear order, and the one number that matters sitting in the corner. Making a dashboard look good is the art. Making sure the eye lands on the right thing first is the science, and the science is what pre-attentive attributes and Gestalt principles are for.
I do not know yet which way the AI tools lean. That is exactly why Step 5 of the framework checks design quality against an agreed standard, and not against how good the dashboard looks.
Long live the dashboard
So the people who said dashboards were dead were wrong, and the people now celebrating them are celebrating the easy part.
Dashboards are not dead. They are about to multiply. When building one costs almost nothing, the useful skill is knowing which ones to trust.
The framework was always tool-agnostic. Tableau, Power BI, Looker, or a prompt to Claude: the five steps do not care where the dashboard was built. They ask whether it answers the agreed question, whether it runs on governed data, and whether someone certified it before anyone acted on it.
I think the dashboards that get built will get better. The design will get better at working with how people see, and the governance of the data underneath will improve too. But we are not there yet. Until we are, everyone who builds or reads these dashboards needs to understand the risk of trusting them implicitly.
Dashboards are easy. Data is hard. Building dashboards just got a lot easier, and that is exactly why the data underneath needs explicit trust.
Frequently Asked Questions
Are dashboards dead now that AI can answer questions about data?
No. Stephen Few defined a dashboard as a visual display of the most important information needed to achieve one or more objectives, arranged so people can monitor it at a glance. People are visual. The eye picks up pre-attentive features such as colour, size and position in under a quarter of a second, and Gestalt principles let people see how a page is organised before they read a number. Wherever a person is part of a decision, they need to see the data, and that means a dashboard of some kind. AI has changed how dashboards get built. It has not changed why people need them.
Why is implicit trust a bigger risk with AI-built dashboards?
Because AI makes polished dashboards cheap, so organisations will have far more of them, and most will be built without anyone checking the definitions underneath. Anthropic's own analytics team describes the danger directly: an answer that is wrong but looks plausible and is used without objection. A polished dashboard on ungoverned data is easy to trust and hard to challenge.
What did Anthropic say it takes for Claude to answer analytics questions accurately?
In June 2026, Anthropic's data team wrote that Claude automates 95 percent of its business analytics queries with about 95 percent accuracy. They said it depended on dimensional modelling, a small set of heavily governed datasets, a business context layer, and agents that clarify the question before they query anything. That is the same foundation the Decision Outcome Framework sets out.
How does the Decision Outcome Framework apply to AI-built dashboards?
The same way it applies to any dashboard. The framework is tool-agnostic. Step 1 defines the business question, Steps 2 to 4 govern and connect the data, and Step 5 certifies the result against the question and a design standard. AI has made the build between Step 4 and Step 5 almost free. It has not removed any of the five steps.
Notes
- Dashboards Are Dead (IDC)
- Nick Mercurio, IDC's Chief Revenue Officer, "Dashboards Are Dead: The Future of Business Intelligence Lives in the Workflow", IDC blog, 7 July 2026. Source
- Claude Dashboards
- Anthropic, "Build live dashboards and animate explainers with Claude", 8 October 2026. Anthropic released Claude Dashboards in beta on paid plans. You can click any number to see the query behind it, and each chart shows when its data was last refreshed. Source
- Dashboard definition
- Stephen Few, "Dashboard Confusion", Perceptual Edge, 20 March 2004. His full definition reads: "A dashboard is a visual display of the most important information needed to achieve one or more objectives; consolidated and arranged on a single screen so the information can be monitored at a glance." Source
- Pre-attentive processing
- Christopher G. Healey and James T. Enns, "Attention and Visual Memory in Visualization and Computer Graphics", IEEE Transactions on Visualization and Computer Graphics, 2012. They treat a task as pre-attentive when people can do it on a busy display in less than 200 to 250 milliseconds. Source
- Gestalt principles
- Cole Nussbaumer Knaflic, Storytelling with Data: A Data Visualization Guide for Business Professionals, Wiley, 2015. Source
- Anthropic's data team
- Josh Cherry, Clement Peng, Johanne Jiao, Justin Leder and Chen Chang, "How Anthropic enables self-service data analytics with Claude", Claude blog, 3 June 2026. The quotes in this piece are theirs, word for word, including the American spelling "modeling". Source
- Trust in data
- HFS Research study, reported by RTInsights, "75% of Executives Don't Trust Their Data", 22 February 2022. Source
The five steps in full.
The Decision Outcome Framework sets out each step, the artefact it produces, and why the Process Owner has to own the data.
Read the Decision Outcome FrameworkMark Cunningham is the founder of Insights². He has spent more than a decade building data and analytics products. He writes at insights-2.com about how to make the meaningful measurable.